 Being book smart is good. The outcome of book smart is rarely better for analytics practitioners then folks trying to learn how to fly an airplane from how-to books.
Hence, I have been obsessed with encouraging you to get actual data to learn from. This is all the way from Aug 2009: Web Analytics Career Advice: Play In The Real World! Or a subsequent post about how to build a successful career: Web Analytics Career Guide: From Zero To Hero In Five Steps. Or compressing my experience into custom reports and advanced segments I've shared.
The problem for many new or experienced analysts has been that they either don't have access to any dataset (newbies) or the data they have access to is finite or from an incomplete or incorrect implementation (experienced). For our Market Motive Analytics training course, we provide students with access to one ecommerce and one non-ecommerce site because they simply can't learn well enough from my magnificent videos. The problem of course is that not everyone is enrolling our course! :)
All this context is the reason that I am really, really excited the team at Google has decided to make a real-world dataset available to everyone on planet Earth (and to all intelligent life forms in the universe that would like to learn digital analytics).
The data belongs to the Google Merchandise Store, where incredibly people buy Google branded stuff for large sums of money (average order value: $115.67, eat your heart out Amazon!). And, happily, it has almost all of the Google Analytics features implemented correctly. This gives Earth's residents almost all the reports we would like to look at, and hence do almost all the analysis you might want to do in your quest to become an Analysis Ninja. (Deepak, would you kindly add Goal Values for the Goals. Merci!) You'll also be able to create your own custom reports, advanced segments, filters, share with the world everything you create, and all kinds of fun stuff.
For consultants and opinion makers you no longer have to accept any baloney peddled to you about what analytics tool is the best or better fit for your company/client. Just get access to this data and play with the actual GA account along with Adobe and IBM and WebTrends et. al. and suddenly your voices/words will have 10x more confidence informed by real-world usage. No NDA's to sign, no software to install, no IT resources required. Awesome, right?
In this post I'll highlight some of my favourite things you can do, and learn from, in the Store dataset. Along the way I'll share some of my favourite metrics and analytics best practices that should accelerate your path to becoming a true Analysis Ninja. I've broken the post into these sections:
I'm sure you are as excited as I am to just get going. Let's go!
How to get Store Dataset Access?
It is brilliantly easy.
Go to the Analytics Help Demo Account page. Read the bit in the gray box titled Important. Digest it.
Then click on this text: ––>ACCESS DEMO ACCOUNT<––
Looks scary in the all caps, right? That is just how the Google Analytics team rolls. :)
You'll see a tab open, urls will flip around, in two seconds you'll see something like this on your Accounts page…

Click on 1 Master View and you are in business.
If you ever want to remove access to this real-world data, just go back to the page above and follow the five simple steps to self-remove access.
Jump-Start Your Learning.
You can start with all the standard reports, but perhaps the fastest way for you to start exploring the best features is to download some of the wonderful solutions in the Google Analytics Solutions Gallery.
You'll find my Occam's Razor Awesomeness bundle there as well.
It is a collection of advanced segments, custom reports, and dashboards. You'll have lots of features incorporated in them. You can customize them to suit your needs, or as you learn more, but you won't have to start with a blank slate.
You can also search for other stuff, like custom reports or attribution models.
Another tip. If you are a complete newbie (welcome to our world!), you probably want to start your journey by reading about each type of report, and then looking at the Overview report in each section in Google Analytics. At this point you'll be a little confused about some metric or the other. That's ok. Go, read one of the best pages in the Analytics help center: Understanding Dimensions and Metrics. Go back into GA, you'll understand a whole lot more.
This is a beginner's advanced guide, so I'm going to do something different. Through my favourite reports, often hard to find in your company's GA dataset, I'm going to push you beyond other beginner's guides. I'll also highlight frameworks, metrics, custom reports, and other elements I feel most Analyst's don't poke around enough.
1. Play with Enhanced Ecommerce Reports.
It is a source of great sadness for me that every single site is not taking advantage of Enhanced Ecommerce tracking and analysis . It is a complete rethink of ecommerce analysis. The kind of reports and metrics you'll get straight out of the box are really amazing.
Go to the Reporting section of our Store Demo account, click on Conversions in the left nav, then Ecommerce, and now Overview. You'll see in an instant the very cool things you can track and analyze…

With a little bit of smart tagging you can track your internal promotions (buy one Make America Great Again hat and get one Stronger Together hat free!), transactions with coupon codes, affiliate sales and more. Very nicely summarized above.
Next go to the report with new things that will help you drive smarter merchandizing on your mobile and desktop websites. Go to Shopping Analysis and click on Shopping Behavior…

I adore this report.
Most of the time when we do funnel analysis we start at the Cart stage (third bar above). We rarely hold people responsible for Traffic Acquisition accountable, we rarely hold people responsible for Site Design and Merchandizing accountable. The former are promoted on silly metrics like Visits or Visitors or (worse) Clicks. The latter are promoted based on silly metrics like PageViews.
The first bar to the second shows the number of visits during which people went from general pages on your website to product pages (places were there is stuff to be sold, add to cart buttons). A lame 26%. See what I mean. Insightful. How are you going to make money if 74% of the visits don't even see a product page!
The second bar the third is even more heart-breaking, as if that were possible. Of the sessions with pages with product views, how many added something to cart. A lousy 17%. One. Seven. Percent! On a site were you can do nothing except buy things.
See what I mean? Question time for your Acquisition, Design and Merchandizing team.
Do you know answers like these for your website? That is why you need Enhanced Ecommerce.
I won't cover the last two bars, most of you are likely over indexing on funnel analysis.
Practice segmentation while you are here. Click on + Add Segment on top of this report, choose Google (or whatever interests you)…

And you can analyze acquisition performance with a unique lens (remember you can't segment the funnel that exists in the old ecommerce reports which is still in your GA account!)…

A little better. Still. You spend money on SEO and PPC. It should be a lot better than this. If this were your data, start with questioning your PPC landing page strategy and then move to looking at your top SEO landing pages, and then look at bounce rates and next page analysis for those that stay.
I can honestly spend hours on just this report digging using segmentation (geo, media, new and loyal customers, all kinds of traffic, product page types and so on). It has been a great way to immediately influence revenue for my ecommerce engagements.
While you are here, you can play and learn to use the new funnel report… it is called Checkout Behavior Analysis…

Much simpler, so much easier to understand.
You can also, FINALLY, segment this report as well. Try it when you are in the Store demo account.
Take a break. A couple days later come back and checkout the new Product Performance and Product List Performance reports. The latter is particularly useful as an aggregated view for senior executives. In case of the Store data, the first report has 500 rows of data, the second just 45. Nice.
I wanted to flag three metrics to look at in the Product Performance report.
Product Refund Amount is $0.00 in this dataset, but for your company this is a great way to track refunds you might have issued and track were more of that is happening.
I love Cart-To-Detail Rate (product adds divided by views of product details) and Buy-to-Detail Rate (unique purchases divided by views of product-detail pages). Remember I was so upset above about the poor merchandizing. Using the sorting option on these two columns I identify where the problem is worse and where I can learn lessons from. Very cool, try it.
I could keep going on about more lovely things you'll find in the Enhanced Ecommerce reports, but let me stop here and have you bump into those cool things as, and I can say this now, you have access to this data as well!
Bonus: If you are a newbie, in your interview you'll be expected to know a lot about Goals (I call the micro-outcomes). Explore that section. Look the Overview, Goal URLs and Smart Goals. Ignore the eminently useless Reverse Goal Path report (I don't even know why this is still in GA after years of uselessness) and Funnel Visualization (almost totally useless in context of almost all Goals).
2. Gain Attribution Modeling Savvy.
My profound disdain for last-click reporting/analysis is well known. If you are using last-click anything, you want your company to make bad decisions. See. Strong feelings.
Yet, many don't have access to a well set-up account to build attribution modeling savvy and take their company's analytics the year 2013. Now, you can!
I am big believer in evolution (hence my marketing and analytics ladders of awesomeness). Hence, start by looking at the Assisted Conversions report (Conversions > Multi-Channel Funnels)…

Then metric you want to get your company used to first, to get them ready for savvier attribution anything, is the metric Assisted Conversions. The last column.
Here's the official definition: A value close to 0 indicates that this channel functioned primarily as the final conversion interaction. A value close to 1 indicates that this channel functioned equally in an assist role and as the final conversion interaction. The more this value exceeds 1, the more this channel functioned in an assist role .
Now scroll just a bit back up, stare at that column, what would your strategy be for Organic Search if it is at 0.46? What about Display advertising driving which plays primarily an "upper funnel" introducing your brand to prospects 1.58?
The change required based on this data is not just your marketing portfolio re-allocation, that is almost trivial, what' bigger, huger, crazy-harder is changing how your company thinks. It is painful. Largely because it quickly becomes about how people's budgets/egos/bonuses. But, hundreds of conversions are on the line as well on insights you'll get from this data. Learn how to use this metric to drive those two changes: marketing portfolio – people thinking.
Couple bonus learnings on this report.
On top of the table you'll see text called Primary Dimension. In that row click on Source/Medium. This is such a simple step, yet brings you next layer of actionable insights so quickly. You'll see some surprises there.
Second, look at the top of the report, you'll see a graph. On to top right of the graph you'll see three buttons, click on the one called Days before Conversion…

I love this report because it helps me understand the distribution of purchase behavior much better. I profoundly dislike averages, they hide insights. This report is the only place you can see distribution of days to purchase for Assisted Conversions.
If you've changed the think in your company with Assisted Conversions… You are ready for the thing that gets a lot of press… Attribution Modeling!
You'll find the report here: Conversions > Attribution > Model Comparison.
You'll see text called Select Model next to Last Interaction. Click on the drop down, ignore all the other models, they are all value deficient, click on the only one with decent-enough value, Time Decay, this is what you'll see…

Half of you reading this post are wondering why I don't like your bff First-Interaction (it is likely the worst one on the list btw) or your bff Linear (the laziest one on the list)… worry not, checkout this post: Multi-Channel Attribution Modeling: The Good, Bad and Ugly Models .
The column you are of course looking at is % Change in Conversions. The GA team is also helping you out by helping you understand where the results are significant, green and red arrows, and where it is directional, up or down gray arrows.
This is the data you'll use to drive discussions about a change in your marketing $$$ allocations.
Where you have CPA, it is is an even more valuable signal. And, such a blessing that the Store demo account has that data for you.
You'll need all your brain power to understand the report above (make sure you read the models post above), and then some more to drive the change in how your company thinks. Attribution model is not a software or math problem, it is an entrenched human minds problem.
And because I'm the author of the quote all data in aggregate is crap I recommend scrolling up a bit in the attribution modeling report and clicking on the down arrow under the word Conversion….

This is admittedly an advanced thing to learn because even understanding marketing dollars plus user behavior overall is hard, this just makes it a bit more complicated because you can actually understand those two things for every goal you have individually or just ecommerce all by itself.
It is incredibly awesome to be able to do that because now you are this super-data-intelligent-genius that can move every variable in a complex regression equation very finely to have max impact on your company.
If you can master this, and IF you can evolve how your company does marketing portfolio allocation and how it thinks, then you are ready for the max you can do in Google Analytics when it comes to attribution… custom attribution modeling.
On top of the table, click on Select Model, then Create New Custom Model.
To get you going, here's one of my models for a client…

Custom attribution models are called custom because they are custom to every company. It requires an understanding for everything I've requested you to do above, business priorities (what the business values), and business strategy.
Creating a couple different custom attribution models, seeing how it affects the data, what decisions GA recommends, helps you have an intelligent argument with all your stake holders. Again, the decisions from this analysis will flow into changes to your marketing portfolio and how people in your company think.
Once you get into custom attribution modeling, and you spend serious amount of money on marketing online (a few million dollars at least), you are ready for the thing that actually will drive the best changes: Controlled Experiments (aka media mix modeling). Hence, it is critical that you approach your learnings in the precise steps above, don't jump steps if at one of them you have not changed how your company thinks.
Bonus 1: You might think the above is plenty advanced. It is not. For the higher order bits, when you are all grown up, read this post and internalize the implications of it: Multi-Channel Attribution: Definitions, Models and a Reality Check
Bonus 2: The Time Lag and Path Length reports in your Multi-Channel Funnels folder are extremely worth learning about. I like Path Length more, more insightful. When you analyze the data, be sure to play with the options under Conversion, Type (click AdWords), Interaction Type and Lookback Window. With each step absorb the patterns that'll emerge in the data. Priceless.
3. Learn Event Tracking's Immense Value
I'm very fond of Event Tracking for one simple reason. You have to create it from scratch. When you open GA, there is no data in these reports. It can only get there if you spend time trying to understand what's important to the business (Digital Marketing and Measurement Model FTW!), what is really worth tracking, and then through intelligent thought implementing the tracking.
I love the fact that you have to literally create data from scratch. For any beginner who is trying to get to advanced, Event Tracking will teach you a lot not just about Event Tracking but creating smart data.
Lucky for us the GA team has created some data for us to play with. Go to Behavior in the left nav, then Events, and then Top Events… This is what you'll see…

The Store team is capturing four events, you can drill down into any one of them to get a deeper peek into user behavior.
I choose Contact Us to analyze the Event Labels, I get all these strategies that people…

It would be valuable if the Event Value had been populated, which would also give us Avg. Value in the table above. Still. Understand that data, how it is collected, what it implies about user behavior is incredibly valuable.
You can also create an advanced segment for any of the events above, example Email. Then, you can apply that segment to any of other reports in Google Analytics and really get deep insights. What cities originate people who call is on the phone? What sites did they come from? How many visits have they made to the site before calling? So on and so forth.
The event tracking reports have three options on top of the report. Event, Site Usage, Ecommerce.
Try the Ecommerce tab…

While we did not see any event values, you can tie the sessions where the events were fired with outcomes on the site. Really useful in so many cases where you invest in special content, rich media, interactive elements, outbound links, merchandizing strategies etc. This report, in those cases, will have data you need to make smarter decisions faster.
Bonus: While you are in the Behavior section of Analytics, familiarize yourself with the Site Speed report. Start with the scorecard in the overview report. Move on to Page Timings to find the pages that might be having issues. One cool and helpful visual is Map Overlap, click the link on top of the graph on the Page Timings report. Close with the Speed Suggestions report. Your IT team needs this data for getting things fixed. Your SEO team can do the begging, if required. :)
4. Obsess, Absolutely Obsess, About Content
It is a source of intense distress for me that there's an extraordinary obsession about traffic acquisition (PPC! Affiliates! Cheat Sheet for Video Ads!), and there is huge obsession with outcomes (Conversion Rate! Revenue!), there is such little attention paid to the thing that sits in the middle of those two things: Content!!
Very few people deeply look at content. Yes, there will be a top pages report or top landing pages report. But, that is barely scratching the surface.
Look. If you suck at content, the greatest acquisition strategy will deliver no outcomes.
Obsess about content dimensions and content metrics.
Since you know some of the normal reports already, let me share with you a report that works on many sites (sadly not all), that not many of you are using.
The Content Drilldown report uses the natural folder structure you are using on your website (if you are) and then aggregates content on those folders to show you performance. Here is what you'll see in the Store demo account you are using…

Nice, right? You are pretty much seeing all of the content consumption behavior in the top ten rows!
A pause though. This report is sub-optimally constructed. It shows Pageviews (good), Unique Pageviews (great) and then three metrics that don't quite work as well: Average Time on Page, Bounce Rate, % Exit (worst metric in GA btw if anyone asks in an interview)…

At a folder level these really help provide any decent insights, and might not even make any sense. Think about it. Bounce Rate for a folder?
Good time for you to learn simple custom reporting.
On top of the report, right under the report title, you'll see a button called Customize. Press it. Choose more optimal metrics, and in a few seconds you'll have a report that you like.
This is the one I created for my use with valu-added content metrics that work better: Average Session Duration, Cart-to-Detail Rate (as it is an ecommerce site) and Page Value (to capture both ecom and goal values at a page level)…

Much better, right? Would you choose a different metric? Please share it via comments below.
Ok. Unpause.
Even a quick eyeballing of the report above already raises great questions related to overall content consumption (Unique Pageviews), merchandizing (Cart-to-Detail Rate) and of course money.
You can now easily drill-down to other more valuable bits of content and user experience.
I click on the first one, most content consumption, to reveal the next level of detail. I can see that Apparel is the biggest cluster of content, with pretty decent Cart-to-Detail Rate…

Depending on the business priorities I can ask questions like how come the summer olympic games stuff no one seems to want (and we spent $140 mil on an Olympics sponsorship, kidding).
At the moment the company has a huge investment in Google Maps branding, so we can look at how various brands are doing… YouTube FTW!

Maps is not doing so well. You can see how this data might make you curious if this list is what your business strategy is expecting will happen? Or, is this how we prioritize content creation? I mean, Go! People are interested in something esoteric like Go (programming language in case you are curious) rather than Nest! What a surprise.
That is what this type of content analysis is so good at.
You can continue to follow the rabbit hole by the way and get down to the individual pages in any folder, like so…

Ten percent Cart-to-Detail Rate is pretty poor, compared to some of the others above. Time to rethink if we should even be selling this combo! If not that, definitely time to look at the page and rethink copy, images, design, and other elements to improve this key metric.
The above custom report is really easy to create, for Subscribers of my newsletter I'll also email a downloadable link for this and other custom reports below.
Bonus: Most people stop at what the reports show in the default view. The GA team does a great job of adding good think and express it all over the standard reports. For example, in context of our discussion here, try the Content Grouping primary dimension. Here you see what happens to the report when I switch to Brands (Content Group)…

Even more useful than what was there before, right? So, how does GA get this data? As in the case of Event Tracking above, the Analyst and business decision making combination are thoughtfully manufacturing data. In this case using the immensely valuable Content Groupings feature. Invest in learning how to use it in the Store demo account, learn how to create content groupings to manufacture useful data. When you interview for higher level Analytics role, or for a first time Analyst role, you'll stand out in the interview because this is hard and requires a lot of business savvy (ironic right, you stand out because of your business savvy in a Data Analyst interview!).
5. SEO & PPC, Because You Should!
Ok, you've waited long enough, time to talk about the thing you likely spend a ton of time on: Acquisition.
Since you likely already know how to report Traffic Source and how to find the Referring URLs and Sessions and… all the normal stuff. Let me focus on two things that are a bit more advanced, and will encourage you to learn things most people likely ignoring.
The first one I want you to immerse yourself in when you are in the Store data is Search Engine Optimization. You know that this is hard because when you go to Acquisition > Campaigns (what!) > Organic Keywords you will see that 95% are labeled "(not provided)". This report is completely useless.
You do have other options to analyze SEO performance. Here's the advanced, advanced, lesson: Search: Not Provided: What Remains, Keyword Data Options, the Future.
But, you also have some ability in Google Analytics itself to do keyword level analysis for Google's organic search traffic. Go to Acquisition > Search Console > Queries. This report shows you the top thousands of keywords (4,974 precisely today in the Store report today). The data is available because the team has configured the Search Console data to connect with GA.
Here's what you'll see…

I sort the data by Clicks, because Impressions is a lot less valuable, and with Clicks I get something closer to Sessions (though they are very different metrics). I immediately value CTR as a metric in this context, you can see the variations above. This is perfect immediate data for SEO discussions.
Average Position is also interesting, perhaps more so for my peers in the SEO team. As a Business Analyst I value Average Position a lot less in a world of hyper-personalized search.
My next data analysis step is to take this data out of GA (click Export on top of the report) and play with it to find macro patterns in the data. I'll start with something simple as creating tag clouds, using Clicks or CTR as contextual metrics. I'll classify each keyword by intent or other clusters to look for insights.
Try these strategies, can you find weaknesses in the Google Store's SEO strategy? How do your insights compare to what you just discovered in the content analysis in terms of what site visitors actually want? Really valuable stuff.
What you cannot do with this data is tie it to the rest of the data in GA for these visitors. You cannot get conversions for example, or Page Depth etc. This is heart-breaking. But, see the not provided post I've linked to above for more strategies and meanwhile you can do some cool things in Google Analytics when it comes to SEO.
Bonus: In the Search Console reports, I also find the Landing Pages report is also helpful because you can flip the center of universe, for the same metrics as above, to landing pages rather than keywords. The insights you get will be helpful for your SEO team but more than that it will be critical for your site content team.
A quick note on the above… for the current data you'll see the Landing Pages report looks a little weird with no data in the Behavior and Conversion columns. Something weird is going on, on my other accounts there is data. The team can fix this in the very near future.
Next, spend a lot of time in the AdWords section.
Both because Paid Search if often a very important part of any company's acquisition strategy, and because at the moment there are few digital acquisition channels as sophisticated and complex as AdWords. When you are getting ready for your interviews, being good at this, really good, is a great way to blow your interviewer away because most people will know only superficial stuff about AdWords.
As if those reasons were not enough, in Google Analytics AdWords is a great place to get used to the complexity that naturally arises from mixing two data sources. In almost all GA AdWords reports the first cluster of data (pink below) will come from AdWords and the second cluster (green brace) is the normal collection of metrics you see in GA…

This will naturally prod you into trying to understand why are Clicks different from Sessions? After-all it is a click that kicks off a session in GA when the person arrives. It is internalizing these subtle nuances that separate a Reporting Squirrel from an Analysis Ninja.
Above view is from the Campaigns report. I usually start there as it gives me great insights into the overall PPC strategy for the company.
While you are learning from this report, here's a little smart tip… Click on the Clicks link on top of the graph you see (you'll see it along with Summary, Site Usage, Goal Set 1, and Ecommerce), you'll get a different set of metrics you should know intimately as well…
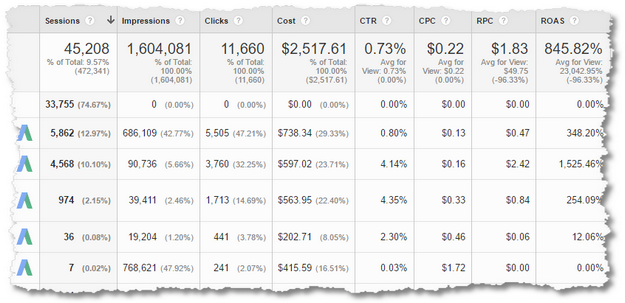
The combination of CPC and RPC is very important. It is nice that they are right next to each other in this view.
When you look at Store data I also want you to live-see why ROAS not even remotely a useful metric. It looks alluring. Return On Ad Spend. That sounds so awesome, surely it is in some holy books! No. It is not.
For now, invest in understanding what is is measuring, what the data shows, is that good or bad, and what's missing. When you already to move to advanced-advanced stage, read this post: Excellent Analytics Tip #24: Obsess About Real Business Profitability
Once I've exhausted the value in Campaign reports (drilling-up, drilling-down, drilling-around), it is time to shift into detail. While it might seem that the very next step will be the AdWords Keyword report, it is not. I like going to the Search Query report first.
In AdWords context, Keyword is what you buy from Google. Search Query on the other hand is what people are actually typing into Google when your search ad shows up (triggered by the Keyword of course).
Here are the two reports from the Store account, you can clearly see why I like starting with the Search Query report….

I would much rather learn to anchor on what people are typing and then go into the Keyword view to see what I can learn there. The Search Query performance report helps me re-think my AdGroups, Match Types, bidding strategies and more. It also helps me optimize the landing pages, both from a content they contain and what ads I recommend send traffic there.
You could spend three months in these reports just learning and finessing your PPS savvy, so I'll leave you to that. :)
Bonus: Shopping Campaigns are incredibly successful for most ecommerce properties. Spend time in that report in the AdWords section, drilling-down and segmenting, to learn what makes these campaigns distinct and if you were tasked to identify insights how would you go about it.
6. Develop a Smarter Understanding of Your Audiences
Having grown up on cookies, we have typically have had a finite understanding of our audiences. This has slowly changed over time, most recently with the awesomeness of User-ID override empowering us to understand a person. Still, most of the time we are not great at digging into Audiences, and their associated behavior.
Hence, to assist with your evolution from beginner to advanced, three often hidden areas of Google Analytics for you to explore now that you have access to real data.
Go to Audience > Interests > In-Market Segments.
Here's the official definition of what you are looking at: Users in these segments are more likely to be ready to purchase products or services in the specified category. These are users lower in the purchase funnel, near the end of the process.
I've developed an appreciation of this report as I think of my performance marketing strategies, especially the ones tied to Display advertising. Far too often we rely on just PPC or email and don't use Display in all of the clever ways possible. This repor, leveraging insights from my users, help me understand how to do smarter Display.

You can drill down to Age by clicking on the in-market segment you are interested in, and from there for each Age group you can drill-down to gender.
Per normal your goal is to identify the most valuable ones using micro and macro-outcomes for your business.
After I've mastered in-market segments by adding near term revenue to my company and helping shift the thinking about Display in my company, I move to leverage the data in the Affinity Categories. Also a report in this section. Affinity categories are great for any display or video advertising strategies you have to build audiences around See Intent (See – Think – Do – Care Business Framework). A bit more advanced from a marketing perspective (you would have had to master strategy #2, attribution, above).
For the second hidden area, go to Audience > User Explorer.
This lovely beast shows something you think you are dying to see. It is also something I really don't want you to obsess about (except if you are a tech support representative). But you want it. So. Here it is…

What you are looking at is a report that shows you the behavior of an individual user on your website, as identified by an anonymous Client-ID. You can loosely think of it as a person, though it is more complicated that. If you have implemented User-ID override (congratulations, you deserve a gold star!), then you areas close to a person as you'll ever be.
Because this is everyone on your website, there is no wrong place to start and a hundred thousand terrible places to waste time. You can literally watch each person! See, what I mean when I say I don't want you to get obsessed about this?
On the rarest of rare occasions I look at this report, my strategy is to understand the behavior of "Whales", people who spend loads of money on our website (why!). I sort the above report by Revenue, and then look over the users who form the first few rows. The data, fi you do it in the Store account for the person who's at the top at the moment, looks like this…

The report is sorted from the last hit (08:16 above) to the first hit (which you don't see above, the person browsed a lot!). You can quite literally watch the behavior, over just five minutes, that lead to an order of $2,211.38! You surely want to know what this person purchased (Men's Cotton Shifts FTW!), what pages did they see, where did they come from, how did they go back and forth (this person did) and so on and so forth.
Looking at the top few of these Whales might help know something about a product merchandizing strategy, a unique source, or how to change your influence with your acquisition strategy to get a few more of these people. There will always only be handful of folks.
The higher order bit is that the best analytical strategy is to analyze micro-segments rather than individuals. Small groups with shared attributes. You can action these, at scale. Nothing in your marketing, site content delivery, servicing at the moment has the capacity to react to an individual's behavior in real time. And if you can, you don't have enough visitors. Hence, obsess about micro-segments. That is a profitable strategy.
The spirit above is also the reason why I don't mention real-time reporting in this guide. Simply not worth it. (For more, see #4: A Big Data Imperative: Driving Big Action)
For the third hidden area, ok, not so hidden but to expose all your analytical talent, go to Audience > Mobile > Devices.
With greater than 50% of your site traffic coming from mobile platforms, this audience report obviously deserves a lot of attention (in addition to segmenting every single report for Mobile, Desktop, Tablet).
The problem is that the report actually looks like this…

It is poorly constructed with repetitive metrics, and an under-appreciation for mobile user behavior (why the emphasis on Do outcomes when Mobile has primarily a See-Think intent clusters?). It makes for poor decision making.
So. Time to practice your custom reporting skills. (Oh, if you as an Analyst only use custom reports, you are closer to being an Analysis Ninja.)
Scroll back to the top of the Mobile Devices report and click on the Customize button. On the subsequent page, pick the metrics you best feel will give you insights into Acquisition, Behavior and Outcomes. While you are at it, you'll see just one dimension in this report, Mobile Device Info, you can add other drill-down dimensions you might find to be of value. I added Screen Resolution (matters so much) and then Page (to analyze each Page's performance by resolution).
Here's what the report's Summary view looks like for me…

Nice, right? Smarter, tighter, more powerful.
My obsession is with people on mobile devices and not just the visits. Hence Users come first. Then, paying homage to See and Think intent, my focus is on Pages/Session. For the same reason, my choice for success is goals and Per Session Value (ideally I would use Per Session Goal Value, but as you saw in the opening this account does not have Goal Values). I would delete the Revenue, it is there mostly in case your boss harassed you. Delete it later.
Depending on the role, Acquisition, Behavior or Outcomes, I have everything I need to start my mobile analysis journey.
As I recommended with AdWords analysis above, the tabs on top of the report hold more analytical insights for you…

You will discover that you'll have to go and practice your custom reporting skills on all these tabs as there are sub-optimal elements on all three of them. For example with Site Usage, I added Think intent metrics. For Goals and Ecommerce tabs there are fewer and more focused metrics. Now almost all of the stuff I need to make smarter decisions from my mobile data is in one place.
This exercise requires a lot of introspection and understanding business needs as well as what analysis makes sense. That is how we all move from Reporting Squirrels to Analysis Ninjas! :)
As with the above custom report, I'll email a downloadable link to the Subscribers of my newsletter The Marketing – analytics Intersect. You can contrast your choices with my choice of metrics and dimensions.
Bonus: If you present screenshots from GA to your management team, make sure you take advantage of the option to show two BFF trends. In my case above you can see I choose to pair mobile Sessions with Goal Completions (again to put the stress on See – Think intent).
7. Icing on the Cake: Benchmarking!
One final beginner's advanced recommendation.
You just finished looking at a whole bunch of mobile metrics. How do you know if the performance of the Google Merchandizing Store is good or bad? Yes, you do see trends of past performance. But, how about with others in your industry? Others who have your type and size of website?
I've convinced that most of the time without that competitive / ecosystem context, Analysis Ninjas are making incomplete decisions.
The cool thing is, you can get benchmarking data in Google Analytics.
Audience > Benchmarking > Devices.
And now you have a really strong sense for what is good performance and what is non-good performance…
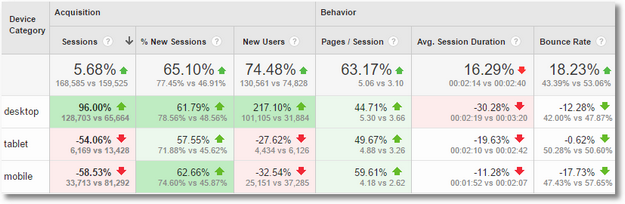
You might have come to one set of conclusions doing the analysis in the mobile section above, and I suspect that now you have very different priorities with the lens pulled back to how the ecosystem is doing.
And, that's the beauty.
There's a lot more you can do with benchmarking. You can explore the advanced-advanced version here when you are ready: Benchmarking Performance: Your Options, Dos, Don'ts and To-Die-Fors!
I hope you have fun.
That is it. A beginner's advanced guide that hopefully accelerates your journey to become an Analysis Ninja.
As always, it is your turn now.
Have already gotten access to the Store demo account? What elements recommended above had you not explored yet? Which ones do you find most easy/frustrating to get actionable insights from? Are there strategies that you use as an Analysis Ninja that are not covered above?
Please share your recommendations, frustrations, :), joyous strategies and guidance with all of us via comments below.
Thank you.
Be Real-World Smart: A Beginner's Advanced Google Analytics Guide is a post from: Occam's Razor by Avinash Kaushik

from Occam's Razor by Avinash Kaushik http://ift.tt/2aO8dEv
via
IFTTT